A clear signal in the midst of Excel-generated noise
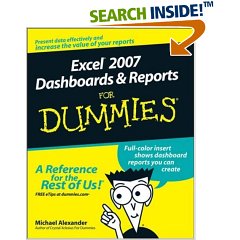
Several months ago I received an email from a fellow named Michael Alexander who wanted my opinion of his technique for producing bullet graphs in Excel. We interacted a bit, and before long Michael mentioned that he was writing his second book for Wiley’s “…for Dummies” series, titled Excel 2007 Dashboards & Reports for Dummies. He asked if I might be willing to write a foreword for the book. I was very honored by his request and indicated my willingness, assuming that I liked what I saw when given the chance to review an advanced copy of the book. Deadlines got in the way of pursuing this plan, which I regret, because I have just read the book and love it.
Michael has managed to do something that’s rare. He has eloquently interwoven the conceptual and technical areas of knowledge that are needed to build effective dashboards in Excel. Technicians often can’t get their heads out of the bits and bytes, and those of a more conceptual ilk often lack technical expertise. Michael has his feet planted firmly in both of these worlds. Technicians often don’t know how to write, but Michael is a refreshing exception to this stereotype as well. This book reads like a conversation.
Unlike most software manuals, this book is rooted in a clear understanding of information—how people use it, why they use it, what really matters to them when they use it, and how to use it effectively. This includes an understanding of data presentation. Michael supports the mission of data visualization evangelists such as Tufte and myself by preaching the gospel of simplicity. He issues clear warnings against the graphical excesses that Excel 2007 encourages. Why? Because it drowns out the clear voice that information needs to tell its story.
This book is finely structured. In roughly 300 pages, it covers all the important aspects of dashboard design in Excel, clearly and without distraction. It is comprehensive, yet simple. Anyone who wishes to develop dashboards in Excel should be able to find everything they need in its pages.
Michael—I’m sorry there was no time to review your book in advance and write a foreword. I would have been honored to recommend it, as I am wholeheartedly doing now.
Take care,


4 Comments on “A clear signal in the midst of Excel-generated noise”
Hi Steve,
I found your post while searching Google Blog search for dashboards. Thanks for the review. I now want to see if the book would be useful for us at our company.
I, too, have found issues with the excesses of Excel, and welcome the opportunity to find simpler ways to do things.
Make it a great day!
Mr. Alexander also has great free video tutorials for Excel, Xcelsius, and Access on the website, datapigtechnologies.com
Hi, this is a very useful blog to get references about data analisys books. Thank’s Mr. Few and all you.
I hope be a classmate in the course of San Francisco, Oct-2008.
It will be a great book! I had read his first book “excel dashboard report” ,and I like that book ,it is useful to me.
It is a pity that we chinese cant read his new book.