MicroStrategy 8.1 dashboards: state of the art perhaps, but definitely not state of the science
MicroStrategy recently announced the release of version 8.1, which supposedly features the “state of the art in business dashboards.” Much like most of the other big business intelligence software vendors, however, MicroStrategy seems to think that the essence of data visualization is flash and dazzle. Here’s how they describe it:
With advanced visualizations that produce ad agency-quality graphics, our pioneering dashboard technology offers a variety of visualizations that let you bring your data to life with beautiful clarity. (Emphasis mine)
Ad agency quality graphics is not the goal that vendors ought seek in an effort to differentiate their dashboards. How about setting themselves apart by being able to honestly say: “Our team of visual communication experts have worked hard to apply the best of information visualization research to the unique requirements and opportunities of dashboards.” So far, I haven’t seen a dashboard product that can make this claim. Too bad. What we’re getting instead is a silly competition among the vendors to out-perform each others with features that don’t matter, because they not only don’t improve a dashboard’s ability to communicate information effectively, they actually obscure the data. “Beautiful clarity” is something I can get excited about, but the sample dashboard below is neither beautiful nor clear:
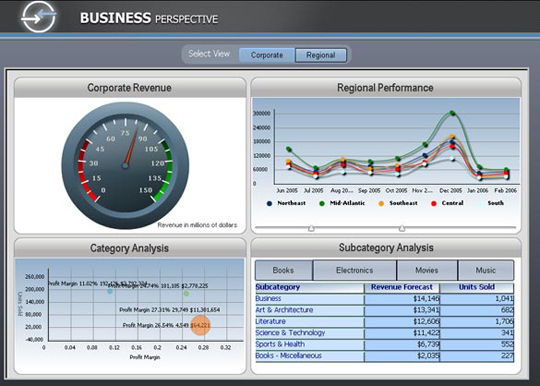
Even the most basic visual design principles have been ignored, or more likely are not even known, by the person who created this sample dashboard. On a properly designed dashboard, this same information could be displayed in a quarter of the space much more meaningfully and with greater clarity. Why are so many BI software vendors copying one another rather than actually taking the time to learn something about data visualization? Effective data visualization is not achieved by using cute gauges and drop shadows, yet the first section of product features page, titled “Beautiful,” begins with the statement:
MicroStrategy 8.1 dashboards are beautiful — with new graph effects, bevels, gradients, semi-transparency, 3D, Bezier curves, drop shadows, and more — all supported by the new High Fidelity Graphing Engine…
Anyone who understands data visualization, especially as it applies to dashboards, would recognize this as a very dangerous list of data-obscuring nonsense.
Stand up to your vendors and remind them of their obligation to become experts in data visualization if they intend to develop and sell data visualization products. Enough already! My eyes are beginning to hurt.
Take care,

10 Comments on “MicroStrategy 8.1 dashboards: state of the art perhaps, but definitely not state of the science”
MicroStrategy’s ad copy should read “we bring chart junk to a whole new level.” That’s just horrible. Are there at least customization options or templates to choose from so that more savvy users can have better options than what you’ve shown?
I can understand the lamentable incentive of providing gaudy, badly designed graphic dashboards to satisfy ill-informed consumers, but I’d at least hope they’d also provide the option of less ridiculous visualizations of the information.
Perhaps the reason the BI SW publishers keep putting this kind of visual output in their products is because this is what sells. I think that the lack of design knowledge that they exhibit is outdone by the management at the companies that consume this “eye candy” because they don’t know what good, clear reporting of relevant data looks like, either, but at least this make it look to them as if their minions have put a lot of time and effort into the production of these showpieces. Remember the old marketing saw, “color sells”? In this case, color, and gee whiz gimmicks sell. Else these folks would go out of business. So they are selling what people want. Perhaps we should rail more about uneducated VIEWERS of these toys, and put the onus where it belongs.
Mark,
I agree that the buyers of BI software are attracted to glitz and gimmickry. This is certainly one of the reasons vendors produce this stuff. The opposite is also true, however.
Buyers expect this stuff because this is what the vendors show them.
The people who buy and use BI software must learn to recognize what really works, and then demand it. This is their responsibility, but the onus must also fall on the vendors to fix the problem.
BI vendors that are courageous enough to take a stand against inneffective glitz and gimmickry by refusing to offer it, instead offering well designed solutions, will differentiate themselves. I believe that this will be a successful sales strategy. For example, Tableau Software has so far offered only what works, refusing to do the silly stuff, and they’ve been enjoying much success. In time, the other vendors will scramble to emulate these brave pioneers.
I’d like to make one other point as well. You refer to the viewers who are attracted to silly ineffective displays as “uneducated,” which is true, but most of the vendors are also uneducated. Very few of them understand data visualization. Very few of them are familiar with the years of information visualization research that reveals what works, what doesn’t, and why. This is inexcusable. The onus falls on them to become experts in this field and to demonstrate that expertise in their products and marketing.
Hey,
I love what you’e doing!
Don’t ever change and best of luck.
Raymon W.
Hmm. As usual with most “critiques” all problems are discussed rabidly. I put critique in inverted commas because what this sort of thing is meant to be is a critique, and what it turns out to be is a series of criticisms.
Don’t just criticise (a futile activity) please give some suggested solutions to the problem with dashboards to get them away from the their current gimmicky form. Ultimatly it is this sort of “eye candy” that business users really want these days to make their already overburdened lives less likely to be further buried in a pile of useless data.
If you browse the contents of this site, especially the Library page, you’ll find many resources that suggest specific solutions to these problems. In fact, I wrote an entire book on the topic. Repeating these solutions over and over in each blog entry would get rather old and boring.
Great work! As a MicroStrategy developer, I have always been frustrated by their visual gimmickry. One example: We work in graphs with numbers that are in their billions (about 13 characters wide including thousands separator). When we abbreviated the numbers (1B instead of 1,000,000,000) using an option their graphing engine provides we were surprised to find that on every single graph we tested this on a variety of data in all ranges, the numbers on the Y-axis kept repeating (in the Y-axis all the numbers were same in most cases; right from the top to bottom)! Pity that they overlook these important functions in lieu of fancy Flash stuff.
I did see a dashboard from MicroStrategy that was more appealing than the rest and would love to here your comments about it.
We love bullet graphs in our company. Keep up your great work!
Thanks.
Does Steve have an opinion on QlikView? Also, what are the main differences between ProClarity and Tableau?
Stan,
My current knowledge of QlikView is limited to what I’ve seen on their website and in a single product briefing. Although QlikView offers many of the silly display gauges that I bemoan, they seem to be more concerned about effective data visualization than most of the vendors who dabble in this product space. I base this opinion on two facts: (1) They exhibit some examples on their website that follow the design principles that I teach fairly closely, and (2) they have told me personally that they care about this stuff. In fact, they have invited me to give keynote presentations at their annual partner and user conferences this spring. I have made it clear that I don’t compromise my principles when I participate in vendor-sponsored events, and wouldn’t refrain from critiquing what they’re doing wrong in addition to what they’re doing right during a presentation. The fact that this doesn’t deter them indicates that they care about data visualization, want to do it well, and believe that they are already on the right path.
Regarding Tableau and ProClarity, it is difficult to compare them. Tableau is an excellent visual analysis product, which was designed by experts in data visualization. ProClarity is more of a typical business intelligence product, which includes some relatively good data visualization capabilities, but nothing that is in the same league as Tableau. It is entirely possible, however, that apart from data visualization functionality, ProClarity might have other features that make it worthwhile for you to consider. I provided two days of training and some consulting for the nice folks of ProClarity a few years ago, prior to their acquisition by Microsoft. At the time, they were planning to improve and expand the data visualization capabilities of their product, based on my suggestions, but I’ve heard that the Microsoft acquisition placed most of these intentions on hold or derailed them entirely.
Steve
Siv,
I’m sorry that it has taken me so long to respond. Expertise in data visualization is in great demand these days, which is encouraging, but exhausting nonetheless. I took a look at the MicroStrategy dashboard that you mentioned and agree that it fairly well designed. If I had more time, I would list a few ways that it could be improved, but in general, it follows the dashboard design principles that I advocate–perhaps intentionally. Despite the ways in which MicroStrategy is still missing the boat (as are most of the vendors in regards to data visualization), it looks like they’re moving in the right direction, at least in part.
Steve