Microsoft vs. Oracle business intelligence – Does Dundas make a difference?
Today I ran across a story published in Australian IT, a web-based news site, entitled “SQL Service put Oracle on Notice,” by Barbara Gengler (July 10, 2007). In it, Gengler pitted the growing business intelligence (BI) capabilities of Microsoft against Oracle, citing the acquisition of Dundas’ data visualization product for SQL Server Reporting Services as a significant boon for Microsoft. I’m not prepared to compare these two behemoth’s BI capabilities (both lack much of what I consider vital), but I can’t resist stating that the acquisition of Dundas’ so-called data visualization capabilities doesn’t count for much. In fact, in my opinion, the inclusion of Dundas in SQL Server Reporting Services is in many respects a setback for Microsoft.
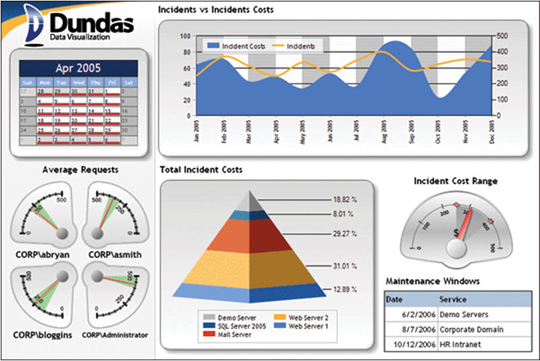
Rather than demonstrating even the slightest understanding of data visualization, the folks who made the decision to acquire Dundas’ software have reinforced my opinion that they still haven’t got a clue. Typical of most producers of visual display widgets, Dundas offers a vast library of charts that look like the work of engineers who sit around saying “Hey, look at what I can make a chart do…isn’t this cool?!” They forgot to include designers who understand that the goal of charts is to communicate data clearly, efficiently, and accurately, not to scream, “Forget the data, look at how cute I am.”
Here are two examples:

I want more from a software company with the resources of Microsoft. I would love to see Microsoft advance BI to a new level by introducing thoughtful and innovative data visualization capabilities. There are some very talented people at Microsoft Research who have the ability to do this, but I have yet to see any evidence of their influence in Microsoft’s products. Rather than banking on its ubiquitous presence and influence throughout the world as an assured fast track to BI dominance, how about demonstrating some of the innovation and thoughtful work? If Microsoft understood data visualization and took pride in its work, the addition of Dundas’ charts to SQL Server Reporting Services would be seen as a source of embarrassment rather than featured news in its BI marketing campaign.
Take care,

One Comment on “Microsoft vs. Oracle business intelligence – Does Dundas make a difference?”
Acquiring Dundas was definitely a step in the wrong direction and unfortunately I’ve only found 1 competitor to Dundas (Teecharts by Steema Software) which I haven’t demo’d yet.
It’s very difficult to change basic properties as description text will get cut off in the interface and you need to navigate through so many menus just to access the right fields. Compared to this I even miss the days of embedding MS Chart objects into Access reports.
If anyone has any good recommendations for visualization addons to use with SQL Server Reporting Services I would definitely love to hear about them.
By the way thanks Stephen for this website. Its been a great learning experience.