| |
|

|
Thanks for taking the time to read my thoughts about Visual Business
Intelligence. This blog provides me (and others on occasion) with a venue for ideas and opinions
that are either too urgent to wait for a full-blown article or too
limited in length, scope, or development to require the larger venue.
For a selection of articles, white papers, and books, please visit
my library.

|
| |
July 24th, 2007
Those of you who are familiar with this website already know that it includes an Examples section, which shows several ineffectively designed graphical displays, along with critiques to explain why they don’t work, and proposed redesigns to show how they could be improved. Many people find these examples helpful, both for raising awareness about the mistakes that people often make when designing graphs, and for instruction in how to effectively communicate graphically.
I have just added two new examples, which you might find worthwhile, which are the first two that appear at the top of the Examples section of this site.
Take care,

July 10th, 2007
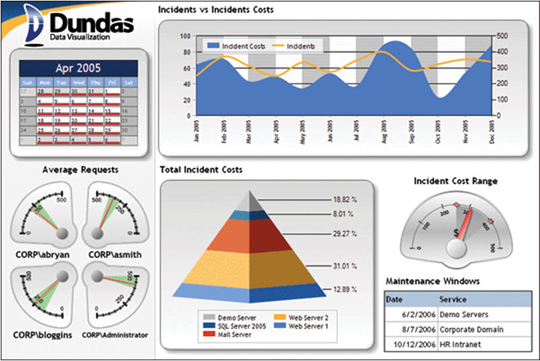
Today I ran across a story published in Australian IT, a web-based news site, entitled “SQL Service put Oracle on Notice,” by Barbara Gengler (July 10, 2007). In it, Gengler pitted the growing business intelligence (BI) capabilities of Microsoft against Oracle, citing the acquisition of Dundas’ data visualization product for SQL Server Reporting Services as a significant boon for Microsoft. I’m not prepared to compare these two behemoth’s BI capabilities (both lack much of what I consider vital), but I can’t resist stating that the acquisition of Dundas’ so-called data visualization capabilities doesn’t count for much. In fact, in my opinion, the inclusion of Dundas in SQL Server Reporting Services is in many respects a setback for Microsoft.
Rather than demonstrating even the slightest understanding of data visualization, the folks who made the decision to acquire Dundas’ software have reinforced my opinion that they still haven’t got a clue. Typical of most producers of visual display widgets, Dundas offers a vast library of charts that look like the work of engineers who sit around saying “Hey, look at what I can make a chart do…isn’t this cool?!” They forgot to include designers who understand that the goal of charts is to communicate data clearly, efficiently, and accurately, not to scream, “Forget the data, look at how cute I am.”
Here are two examples:
I want more from a software company with the resources of Microsoft. I would love to see Microsoft advance BI to a new level by introducing thoughtful and innovative data visualization capabilities. There are some very talented people at Microsoft Research who have the ability to do this, but I have yet to see any evidence of their influence in Microsoft’s products. Rather than banking on its ubiquitous presence and influence throughout the world as an assured fast track to BI dominance, how about demonstrating some of the innovation and thoughtful work? If Microsoft understood data visualization and took pride in its work, the addition of Dundas’ charts to SQL Server Reporting Services would be seen as a source of embarrassment rather than featured news in its BI marketing campaign.
Take care,

July 2nd, 2007
I returned late last week from nearly three weeks of work in Europe, which ended with a two-day workshop that I taught for the Swiss Statistical Society. Nestled in a majestic valley in the Swiss Alps, we spent our days talking about how these talented statistical analysts could enhance their work by learning to communicate their findings more clearly and by using their eyes to supplement abstract statistical techniques. Later this year at their annual conference, they will hear a keynote presentation from Michael Friendly, Ph.D., who is a professor in the Department of Psychology at York University in Toronto, Canada. Among his many talents, Friendly is a trained statistician and an aficionado in the use of visual techniques for statistical analysis. Along with two other authors, Forrest W. Young, Ph.D., of the University of North Carolina (recently deceased), and Pedro M. Valero-Mora, Ph.D, of the University of Valencia in Spain, Friendly has written a new book on the topic entitled Visual Statistics: Seeing Data with Dynamic Interactive Graphics (John Wiley & Sons, Inc., 2006). Always eager to find new sources of insight into data visualization, especially as it applies to analysis, I read the book during my recent stay in Europe.
I don’t intend to review the book comprehensively in this brief blog post, but I would like to comment on its potential usefulness for my primary audience, which consists largely of business people who work with data, but lack advanced statistical training. I was encouraged when I began to read the introduction that this might be a book I could recommend to this audience. The authors’ message rang true to my experience and seemed to share my goals:
Statistical data analysis provides the most powerful tools for understanding data, but the systems currently available for statistical analysis are based on a 40-year-old computing model, and have become much too complex. What we need is a simpler way of using these powerful analysis tools.
Visual statistics is a simpler way. Its dynamic interactive graphics are in fact an interface to these time-proven statistical analysis tools, an interface that presents the results of the hidden tools in a way that helps ensure that out intuitive visual understanding is commensurate with the mathematical statistics under the surface. Thus, visual statistics eases and strengthens the way we understand data and, therefore, eases and strengthens our scientific understanding of the world around us.
…
It is our aim to communicate the intrigue of statistical detective work and the satisfaction and excitement of statistical discovery, by emphasizing visual intuition without resorting to mathematical callesthenics [sic]…Seldom is there mention of populations, samples, hypothesis tests, and probability levels…This book is written for readers without strong mathematical or statistical background, those who are afraid of mathematics or who judge their mathematical skills to be inadequate; those who have had negative experiences with statistics or mathematics, and those who have not recently exercised their match or stats skills. Parts I, II, and III are for you.
The book only seems to consist only of Parts I, II, and III, so I interpret the final statement to mean that non-statisticians should find the book non-intimidating and accessible. What I discovered in reading the book, however, is that, despite how useful it might be as a primer in visual analysis for statisticians, it is steeped in the concepts and language of statistics, and lacks the explanations that would be needed by non-statisticians to make use of the material. I have no doubt that the authors attempted to reach out to non-statisticians. I suspect, however, that they are too immersed in an academic statistical mindset to recognize when they are using terms and discussing concepts that are unfamiliar to the uninitiated. Terms such as Box-Cox transformation, Euclidean space, kernel density curve, p-value, and Pearson’s chi square are par for the course. Early in chapter 2, which provides some actual data sets and analytical challenges that are used throughout the book, the reader is already faced with material like the following:
The spreadplot (a kind of multiplot visualization that is introduced in chapter 4) for the initial model, (GPE)(M) is shown in Figure 2.9 (on the following two pages). This model fits very poorly, of course (G2 = 107, df = 7, p < 0.001). The G2 measure is a badness-of-fit measure. Low values are good, high values are bad. The empty model, reported here, has a very large value of G2, meaning the fit is very poor, which, of course, it must be, since it has no terms. The hypothesis test, when rejected, as is the case here, indicates that the model does not fit the data.
At this point, as someone whose statistical knowledge can fit comfortably in a thimble, my eyes began to glaze over. Please don’t misunderstand me. I am not saying that this is not a good book. I suspect that this is a very important book for statisticians, because it introduces them to the power of visual analysis, which most statisticians under-appreciate. This just isn’t a book for non-statisticians.
One more observation that I want to make about this book is one that applies to many books on data visualization: the value of books on this topic is dramatically undermined when they are not printed in color. I felt badly for the authors when they bemoaned this unfortunate decision by the publisher to save costs by printing the book in black-on-white:
Unfortunately, mosaic displays are best viewed in color, and we are forced to use black and white. (We do the best we can, but to be honest, the black-and-white versions…do not do justice to the mosaic displays. If you can view this online, please do; it will help).
It wasn’t only the mosaic displays that would have benefited from color. Perhaps the authors already had their contract in place with John Wiley & Sons, Inc., before they realized that color was not an option, and then found that they had no power to change this. If you ever plan to write a book about data visualization, get an up-front guarantee from the publisher that the book will be printed in color, or you’ll end up having to make sad disclaimers to your readers like the one above.
Take care,
June 3rd, 2007
No software product is used more than Microsoft Excel for the analysis and presentation of quantitative data. While its use is prolific, and it does some things very well, its charting functionality is rather sad. The charts feature dazzling visual effects that are perhaps useful for marketing, but you can only use them to present data effectively with discouraging effort. Nevertheless, it is fair to say that you can use Excel to present data effectively, but within severe limits, and only if you’re willing to work around its problems. To say it can be used for visual data analysis, however, is a stretch that exceeds its reach. To date, Excel is at best an infant in the world of visual data analysis, barely able to roll over.
Those of you who are familiar with visual data analysis and what good software does to support it will find Microsoft’s notion of visual data analysis entertaining. I invite you to watch Microsoft’s demo and let me know what you think of it. I suspect that the folks at Microsoft Research who understand information visualization must look at this and cringe.
Take care,
May 21st, 2007
You’ve got to hand it to the marketing folks at Business Objects: they’ve got balls. They don’t hesitate to make claims that are backed up by nothing but illusion. With the introduction of their new website called Business Objects Insight, however, they’ve taken marketing chutzpah to a whole new level. Want to solve the world’s great problems? Welcome to Business Objects Insight, the “world’s first mind grid,” the only site that provides “tools for data visualization, data collaboration, and a platform to publish challenges to the online community.” The challenges take on great problems of the modern world, such as global warming. Ignoring the fact that they are not the only site that does this (I’ll tell you about Many Eye’s in a moment), let’s look at what they’re actually providing.
Data visualization: What they call data visualization is really just Crystal Xcelsius, their product that makes the analysis and presentation of data look like a video game and work about as effectively as a eunuch in heat.
Data collaboration: I can’t tell that any collaborative functionality has been built into the site, other than a blog and the fact that people can display their Xcelsius applications there and others can look at and use them. As far as data collaboration goes, this is rather anemic.
Platform for challenges: This isn’t really a feature; it’s the declared purpose of the site. Participants are being challenged to develop data visualization’s using Xcelsius that are designed to solve major world problems. And why should people make the effort to save the world and why should they channel their world-saving talent into learning and using Xcelsius to do so? Because Business Objects is going to pay a heart-stopping million dollars to the creators of the best world-saving applications (or actually “up to a million dollars”, which, if you think about it could actually mean nothing at all).
This strikes me as a thinly-veiled marketing scheme to sell more copies of Xcelsius under the guise of solving world problems. Business Objects’ founder and Chairman Bernard Liautard declares:
Today the world becomes more intelligent. While there are a number of sites dedicated to aggregating and analyzing data, Insight is unique in providing members with tools for data visualization, data collaboration, and a platform to publish challenges to the online community. Our goal is to change the way problems get solved, to work on issues that have a global impact, and to challenge the conventions and paradigms of online communities.
Wow, this is quite a claim. If only Business Objects had the know-how and technology to do it. Until they actually develop or hire some expertise in the field of data visualization, they should stop claiming that they are using visualization methods to tackle even the simplest problems, let alone the great problems that plague our world. And until they have tools that provide effective visualization functionality, rather than the child’s toy of a product called Xcelsius, they should stick to selling data reporting tools that depend on the conventional paradigm of purely text-based displays.
If you’re interested in seeing a site that effectively uses data visualization as a means for people to exchange information and insights related to world problems, and does so in a way that supports true collaboration, take a look at Many Eyes, which was developed by IBM Research. The reason this site succeeds where Business Objects Insight does not is because it was designed by people who are experts in data visualization and data collaboration. Although the folks at Many Eyes are not making any grand claims about saving the world, they are providing a platform that could actually be used to support this effort.
What’s so sad about this is that there are real problems in the world that need solving, but Business Objects Insight, with its dysfunctional tools, will only waste people’s time, frittering away well-intentioned efforts and potentially good ideas that could be better applied elsewhere. If Business Objects really wants to help solve the problems of the world, why not throw their weight behind a data visualization and collaboration site that really works? Perhaps they have an ulterior goal.
Take care,
|