| |
|

|
Thanks for taking the time to read my thoughts about Visual Business
Intelligence. This blog provides me (and others on occasion) with a venue for ideas and opinions
that are either too urgent to wait for a full-blown article or too
limited in length, scope, or development to require the larger venue.
For a selection of articles, white papers, and books, please visit
my library.

|
| |
May 3rd, 2016
Adam Grant of the Wharton School of Business has written a marvelous new book titled Originals: How Non-Conformists Move the World.
Similar to Malcolm Gladwell’s book Outliers, Grant’s book shows that originality is not something we’re born with but something that we can learn. We heap high praise on original thinkers who manage to make their mark on the world, yet our default response is to discourage original thinking. Being a non-conformist takes courage. Without useful originality, there is no progress. How do we foster greater originality in our world and in ourselves? Grant does a wonderful job of telling us how.
According to Grant, “Originality involves introducing and advancing an idea that’s relatively unusual within a particular domain, and that has the potential to improve it.” “Originals” are more than idea generators. “Originals are people who take the initiative to make their visions a reality.”
Allow me to whet your appetite for this book by sharing a few excepts that spoke to me.
The hallmark of originality is rejecting the default and exploring whether a better option exists…The starting point is curiosity…”
They [originals] feel the same fear, the same doubt, as the rest of us. What sets them apart is that they take action anyway. They know in their hearts that failing would yield less regret than failing to try.
Broad and deep experience is critical for creativity. In a recent study comparing every Nobel Prize-winning scientist from 1901 to 2005 with typical scientists of the same era, both groups attained deep expertise in their respective field of study. But the Nobel Prize winners were dramatically more likely to be involved in the arts than less accomplished scientists.
Procrastination may be the enemy of productivity, but it can be a resource for creativity. Long before the modern obsession with efficiency precipitated by the Industrial Revolution and the Protestant work ethic, civilizations recognized the benefits of procrastination. In ancient Egypt, there were two different verbs for procrastination: one denoted laziness; the other meant waiting for the right time.
“Dissenting for the sake of dissenting is not useful. It is also not useful if it is ‘pretend dissent’—for example, if role-played,” [Charlan] Nemeth explains. “It is not useful if motivated by considerations other than searching for the truth or the best solutions. But when it is authentic, it stimulates thought; it clarifies and emboldens.”
“Shapers” are independent thinkers, curious, non-conforming, and rebellious. They practice brutal, nonhierarchical honesty. And they act in the face of risk, because their fear of not succeeding exceeds their fear of failing.
The easiest way to encourage non-conformity is to introduce a single dissenter…Merely knowing that you’re not the only resister makes it substantially easier to reject the crowd.
If you want people to take risks, you need first to show what’s wrong with the present. To drive people out of their comfort zones, you have to cultivate dissatisfaction, frustration, or anger at the current state of affairs, making it a guaranteed loss.
To channel anger productively, instead of venting about the harm a perpetrator has done, we need to reflect on the victims who have suffered from it…Focusing on the victim activates what psychologists call empathetic anger—the desire to right wrongs done to another.
I hope that this brief glimpse into Originals is enough to convince you of its worth. We need more originals to solve the many, often complex problems that threaten us today. This book doesn’t just make this case, it outlines a plan for making it happen.
Take care,

April 29th, 2016
Todd Rose, director of the “Mind, Brain, and Education” program at the Harvard Graduate School of Education, has written a brilliant and important new book titled The End of Average.
In it he argues that our notion of average, when applied to human beings, is terribly misguided. The belief that variation can be summarized using measures of center is often erroneous, especially when describing people. The “average person” does not exist, but the notion of the “Average Man” is deeply rooted in our culture and social institutions.
Sometimes variation—individuality—is the norm, with no meaningful measure of average. Consider the wonderful advances that have been made in neuroscience over the past 20 years or so. We now know so much more about the average brain and how it functions. Or do we? Some of what we think we know is a fabrication based on averaging the data.
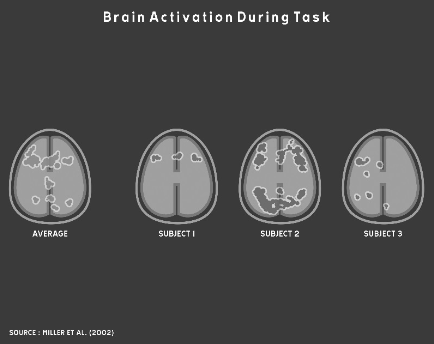
In 2002, Michael Miller, a neuroscientist at UC Santa Barbara, did a study of verbal memory using brain scans. Rose describes this study as follows:
One by one, sixteen participants lay down in an fMRI brain scanner and were shown a set of words. After a rest period, a second series of words was presented and they pressed a button whenever they recognized a word from the first series. As each participant decided whether he had seen a particular word before, the machine scanned his brain and created a digital “map” of his brain’s activity. When Miller finished his experiment, he reported his findings the same way every neuroscientist does: by averaging together all the individual brain maps from his subjects to create a map of the Average Brain. Miller’s expectation was that this average map would reveal the neural circuits involved in verbal memory in the typical human brain…
There would be nothing strange about Miller reporting the findings of his study by publishing a map of the Average Brain. What was strange was the fact that when Miller sat down to analyze his results, something made him decide to look more carefully at the individual maps of his research participants’ brains… “It was pretty startling,” Miller told me. “Maybe if you scrunched up your eyes real tight, a couple of the individual maps looked like the average map. But most didn’t look like the average map at all.”
The following set of brain scans from Miller’s study illustrates the problem:
As you can see, averaging variation in cases like this does not accurately or usefully represent the data or the underlying phenomena. Unfortunately, this sort of averaging remains common practice in biology and social sciences. As Rose says, “Every discipline that studies human beings has long relied on the same core method of research: put a group of people into some experimental condition, determine their average response to the condition, then use this average to formulate a general conclusion about all people.”
This problem can be traced back to Belgian astronomer turned social scientist Adolphe Quetelet in the early 19th century. Quetelet (pronounced “kettle-lay”) took the statistical mean down a dark path that has since become a deep and dangerous rut. Sciences that study human beings have fallen into this rut and become trapped ever since. Many of the erroneous findings in these fields of research can be traced this fundamental misunderstanding and misuse of averages. It’s time to build a ladder and climb out of this hole.
When Quetelet began his career as an astronomer in the early 19th century, the telescope had recently revolutionized the science. Astronomers were producing a deluge of measurements about heavenly bodies. It was soon observed, however, that multiple measurements of the same things differed somewhat, which became known as the margin of error. These minor differences in measurements of physical phenomena almost always varied symmetrically around the arithmetic mean. Recognition of the “normal distribution” emerged in large part as a result of these observations. When Quetelet’s ambition to build a world-class observatory in Belgium was dashed because the country became embroiled in revolution, he began to wonder if it might be possible to develop a science for managing society. Could the methods of science that he learned as an astronomer be applied to the study of human behavior? The timing of his speculation was fortunate, for it coincided with the 19th century’s version of so-called “Big Data” as a tsunami of printed numbers. The development of large-scale bureaucracies and militaries led to the publication of huge collections of social data. Quetelet surfed this tsunami with great skill and managed to construct a methodology for social science that was firmly built on the use of averages.
Quetelet thought of the average as the ideal. When he calculated the average chest circumference of Scottish soldiers, he thought of it as the chest size of the “true” soldier and all deviations from that ideal as instances of error. As he extended his work to describe humanity in general, he coined the term the “Average Man.”
This notion of average as ideal, however, was later revised by one of Quetelet’s followers—Sir Francis Galton—into our modern notion of average as mediocre, which he associated with the lower classes. He believed that we should strive to improve on the average. Galton developed a ranking system for human beings consisting of fourteen distinct classes with “Imbeciles” at the bottom and “Eminent” members of society at the top. Further, he believed that the measure of any one human characteristic or ability could serve as a proxy for all other measures. For example, if you were wealthy, you must also be intelligent and morally superior. In 1909 Galton argued, “As statistics have shown, the best qualities are largely correlated.” To provide evidence for his belief, Galton developed statistical methods for measuring correlation, which we still use today.
Out of this work, first by Quetelet and later by Galton, the notion of the Average Man and the appropriateness of comparing people based on rankings became unconscious assumptions on which the industrial age was built. Our schools were reformed to produce people with the standardized set of basic skills that was needed in the industrial workplace. In the beginning of the 20th century, this effort was indeed an educational reform, for only six percent of Americans graduated from high school. Students were given grades to rank them in ability and intelligence. In the workplace, hiring practices and performance evaluations soon became based on a system of rankings as well. The role of “manager” emerged to distinguish above-average workers who were needed to direct the efforts of less capable, average workers.
I could go on, but I don’t want to spoil this marvelous book for you. I’ll let an excerpt from the book’s dust cover suffice to give you a more complete sense of the book’s scope:
In The End of Average, Rose shows that no one is average. Not you. Not your kids. Not your employees or students. This isn’t hollow sloganeering—it’s a mathematical fact with enormous practical consequences. But while we know people learn and develop in distinctive ways, these unique patterns of behaviors are lost in our schools and businesses which have been designed around the mythical “average person.” For more than a century, this average-size-fits-all model has ignored our individuality and failed at recognizing talent. It’s time to change that.
Weaving science, history, and his experience as a high school dropout, Rose brings to life the untold story of how we came to embrace the scientifically flawed idea that averages can be used to understand individuals and offers a powerful alternative.
I heartily recommend this book.
Take care,
April 19th, 2016
This blog entry was written by Nick Desbarats of Perceptual Edge.
In recent decades, one of the most well-supported findings from research in various sub-disciplines of psychology, philosophy and economics is that we all commit elementary reasoning errors on an alarmingly regular basis. We attribute the actions of others to their fundamental personalities and values, but our own actions to the circumstances in which we find ourselves in the moment. We draw highly confident conclusions based on tiny scraps of information. We conflate correlation with causation. We see patterns where none exist, and miss very obvious ones that don’t fit with our assumptions about how the world works.
Even “expert reasoners” such as trained statisticians, logicians, and economists routinely make basic logical missteps, particularly when confronted with problems that were rare or non-existent until a few centuries ago, such as those involving statistics, evidence, and quantified probabilities. Our brains simply haven’t had time to evolve to think about these new types of problems intuitively, and we’re paying a high price for this evolutionary lag. The consequences of mistakes, such as placing anecdotal experience above the results of controlled experiments, range from annoying to horrific. In fields such as medicine and foreign policy, such mistakes have certainly cost millions of lives and, when reasoning about contemporary problems such as climate change, the stakes may be even higher.
As people who analyze data as part of our jobs or passions (or, ideally, both), we have perhaps more opportunities than most to make such reasoning errors, since we so frequently work with large data sets, statistics, quantitative relationships, and other concepts and entities that our brains haven’t yet evolved to process intuitively.
In his wonderful 2015 book, Mindware: Tools for Smart Thinking, Richard Nisbett uses more reserved language, pitching this “thinking manual” mainly as a guide to help individuals make better decisions or, at least, fewer reasoning errors in their day-to-day lives. I think that this undersells the importance of the concepts in this book, but this more personal appeal probably means that this crucial book will be read by more people, so Nisbett’s misplaced humility can be forgiven.
 Mindware consists of roughly 100 “smart thinking” concepts, drawn from a variety of disciplines. Nesbitt includes only concepts that can be easily taught and understood, and that are useful in situations that arise frequently in modern, everyday life. “Summing up” sections at the end of each chapter usefully summarize key concepts to increase retention. Although Nesbitt is a psychologist, he draws heavily on fields such as statistics, microeconomics, epistemology, and Eastern dialectical reasoning, in addition to psychological research fields such as cognitive biases, behavioral economics, and positive psychology.
The resulting “greatest hits” of reasoning tools is an eclectic but extremely practical collection, covering concepts as varied as the sunk cost fallacy, confirmation bias, the law of large numbers, the endowment effect, and multiple regression analysis, among many others. For anyone who’s not yet familiar with most of these terms, however, Mindware may not be the gentlest way to be introduced to them, and first tackling a few books by Malcolm Gladwell, the Heath brothers, or Jonah Lehrer (despite the unfortunate plagiarism infractions) may serve as a more accessible introduction. Readers of Daniel Kahneman, Daniel Ariely, or Gerd Gigerenzer will find themselves in familiar territory fairly often, but will still almost certainly come away with valuable new “tools for smart thinking,” as I did.
Being aware of the nature and prevalence of reasoning mistakes doesn’t guarantee that we won’t make them ourselves, however, and Nisbett admits that he catches himself making them with disquieting regularity. He cites research that suggests, however, that knowledge of thinking errors does reduce the risk of committing them. Possibly more importantly, it seems clear that knowledge of these errors makes it considerably more likely that we’ll spot them when they’re committed by others, and that we’ll be better equipped to discuss and address them when we see them. Because those others are so often high-profile journalists, politicians, domain experts, and captains of industry, this knowledge has the potential to make a big difference in the world, and Mindware should be on as many personal and academic reading lists as possible.
Nick Desbarats
April 4th, 2016
We review published research studies for several reasons. One is to become familiar with the authors’ findings. Another is to provide useful feedback to the authors. I review infovis research papers for several other reasons as well. My primary reason is to learn, and this goal is always satisfied—I always learn something—but the insights are often unintended by the authors. By reviewing research papers, I sharpen my ability to think critically. I’d like to illustrate the richness of this experience by sharing the observations that I made when I recently reviewed a study by Drew Skau, Lane Harrison, and Robert Kosara titled “An Evaluation of the Impact of Visual Embellishments in Bar Charts,” published in the Eurographics Conference on Visualization (EuroVis). My primary purpose here is not to reveal flaws in this study, but to show how a close review can lead to new ways of thinking and to thinking about new things.
This research study sought to compare the effectiveness of bar graphs that have been visually embellished in various ways to those of normal design to see if the embellishments led to perceptual difficulties, resulting in errors. The following figure from the paper illustrates a graph of normal design (baseline) and six types of embellishments (rounded tops, triangular bars, capped bars, overlapping triangular bars, quadratically increasing bars, and bars that extend below the baseline).
The study consisted of two experiments. The first involved “absolute judgments” (i.e., decoding the value of a single bar) and the second involved “relative judgments” (i.e., determining the percentage of one bar’s height relative to another). Here’s an example question that test subjects were asked in the “absolute judgments” experiment: “In the chart below, what is the value of C?”
As you can see, the Y axis and scale only include two values: 0 at the baseline and 100 at the top. More about this later. Here’s an example question in the “relative judgments” experiment: “In the chart below, what percentage is B of A?”
As you can see, when relative judgments were tested, the charts did not include a Y axis with a quantitative scale.
Let’s consider one of the first concerns that I encountered when reviewing this study. Is the perceptual task that subjects performed in the “absolute judgment” experiment actually different from the one they performed in the “relative judgment” experiment? By absolute judgment, the authors meant that subjects would use the quantitative scale along the Y axis to decode the specified bar’s value. Ordinarily, we read values in a bar graph by associating its height to the nearest value along the quantitative scale and then adjusting it slightly up or down depending on whether it is above or below that value. In this experiment, however, only the value of 100 on the scale is useful for interpreting a bar’s value. Given the fact that the top of the Y axis marked a value of 100, its height represented a value of 100% to which the bar could be compared. In other words, the task involved a relative comparison of a bar’s height to the Y axis’ height of 100%, which is perceptually the same as comparing the height of one bar to another. Although perceptually equal, tasks in the “absolute judgment” experiment were slightly easier cognitively because the height of the Y axis was labeled 100, as in 100%, which provided some assistance that was missing when subjects were asked to compare the relative heights of two bars, neither of which had values associated with them.
Why did the authors design two experiments of perception that they described as different when both involved the same perceptual task? They didn’t notice that they were in fact the same. I suspect that this happened because they designed their graphs in a manner that emulated the design that was used by Cleveland and McGill in their landmark study titled “Graphical Perception: Theory, Experimentation, and Application to the Development of Graphical Methods.” In that original study, the graphs all had a Y axis with a scale that included only the values 0 and 100, but test subjects were only asked to make relative judgments, similar to those that were performed in the “relative judgment” experiment in the new study. The authors of the new study went wrong when they added an experiment to test “absolute judgments” without giving the graphs a normal quantitative scale that consisted of several values between 0 and 100.
Despite the equivalence of the perceptual tasks that subjects performed in both experiments, the authors went on to report significant differences between the results of these experiments. Knowing that the perceptual tasks were essentially the same, this led me to speculate about the causes of these differences. This speculation led me to a realization that I’d never previously considered. It occurred to me that in the “relative judgment” experiment, subjects might have been asked at times to determine “What percentage is A of B?” when A was larger than B. Think about it. Relative comparisons between two values (i.e., what is the percentage of bar A compared to bar B) are more difficult when A is larger than B. For example, it is relatively easy to assess a relative proportion when bar A is four-fifths the height of bar B (i.e., 80%), but more difficult to assess a relative proportion when bar A is five-fours the height of bar B (i.e., 125%). The former operation can be performed as a single perceptual task, but the latter requires a multi-step process. Comparing A to B when A is 25% greater in value than B requires one to perceptually isolate the portion of bar A that extends above the height of bar B, compare that portion only to the height of bar B, and then add the result of 25% to 100% to get the full relative value of 125%. This is cognitively more complex, involving a mathematical operation, and more perceptually difficult because the portion of bar A that exceeds the height of bar B is not aligned with the base of bar B.
Observation #1: Relative comparisons of one bar to another are more difficult when you must express the proportional difference of the greater bar.
Equipped with this possible explanation for the differences in the two experiments’ results, I emailed the authors to request a copy of their data so I could confirm my hypothesis. This led to the next useful insight. Although receptive to my request, only one author had access to the data and it was not readily accessible. The one author with the data was buried in activity. I finally received it after waiting for six weeks. I understand that people get busy and my request was certainly not this fellow’s priority. What surprised me, however, is that the data file wasn’t already prepared for easy distribution. A similar request to a different team of authors also resulted in bit of a delay, but in that case only about half of the data that I requested was ever provided because the remainder was missing, even though the paper had only been recently published. These two experiences have reinforced my suspicion that data sets associated with published studies are not routinely prepared for distribution and might not even exist. This seems like a glaring hole in the process of publishing research. Data must be made available for review. Checking the data can reveal errors in the work and sometimes even intentional fabrication of the results. In fact, I’ll cause the infovis research community to gasp in dismay by arguing that peer reviews should routinely involve a review of the data. Peer reviewers are not paid for their time and many of them review several papers each year. As a result, many peer reviews are done at lightning speed with little attention, resulting in poor quality. To most reviewers, a requirement that they review the data would make participation in the process unattractive and impractical. Without this, however, the peer review process is incomplete.
Observation #2: Data sets associated with research studies are not routinely made available.
When I first got my hands on the data, I quickly checked to see if greater errors in relative judgments were related to comparing bars when the first bar was greater in value than the second, as I hypothesized. What I soon discovered, however, was something that the authors didn’t mention in their paper: in all cases the first bar was shorter than the second. For example, if the question was “What percentage is B of A?”, B (the first bar mentioned) was shorter than A (the second bar mentioned). So much for my hypothesis. What the hell, then, was causing greater errors in the “relative judgment” experiment?
Before diving into the data it occurred to me that I should first confirm that greater errors actually did exist in the “relative judgment” experiment compared to the “absolute judgment” experiment. They certainly seemed to when using the statistical mean as a measure of average error. However, when the mean is used in this way, we need to confirm that it’s based on a normal distribution of values, otherwise it’s not a useful measure of center. Looking at the distributions of errors, I discovered that there were many huge outliers. Correct answers could never exceed 100%, which was the case when bars were equal in height, but I found values as large as 54,654%. These many outliers wreaked havoc on the results when based on the mean, especially in the “relative judgment” experiment. When I switched from the mean to the median as a measure of central tendency the differences between the two experiments vanished. Discovering this was a useful reminder that researchers often misuse statistics.
Observation #3: Even experienced infovis researchers sometimes base their results on inappropriate statistics.
Having switched from the mean to the median, I spent some time exploring the data from this new perspective. In the process, I stumbled onto an observation that makes perfect sense, but which I’d never consciously considered. Our errors in assessing the relative heights of bars are related to the difference between the heights: the greater the difference, the greater the error. Furthermore, this relationship appears to be logarithmic.
In the two graphs below, the intervals along the X axis represent the proportions of one bar’s height to the other, expressed as a percentage. For example, if the first bar is half the height of the second to which it is compared, the proportion would be 50%. If the two bars were the same height, the proportion would be 100%. In the upper graph the scale along the Y axis represents the median percentage of error that test subjects committed when comparing bars with proportions that fell within each interval along the X axis. The lower graph is the same except that it displays the mean rather than the median percentage of error in proportional judgments.
 As you can see, when the first bar is less than 10% of the second bar’s height, errors in judgment are greatest. As you progress from one interval to the next along the X axis, errors in judgment consistently decrease and do so logarithmically. I might not be the first person to notice this, but I’ve never run across it. This is a case where data generated in this study produced a finding that wasn’t intended and wasn’t noticed by the authors. Had I only examined the errors expressed as means rather than medians, I might have never made this observation.
Observation #4: Errors in proportional bar height comparisons appear to decrease logarithmically as the difference in their relative heights decreases.
At this point in my review, I was still left wondering why the vast majority of outliers occurred in the “relative judgment” experiment. Tracking this down took a bit more detective work, this time using a magnifying glass to look at the details. What I found were errors of various types that could have have been prevented by more careful experimental design. Test subjects were recruited using Mechanical Turk. Using Mechanical Turk as a pool for test subjects requires that you vet subjects with care. Unlike a direct interaction between test subjects and experimenters, anonymous subjects that participate in Mechanical Turk can more easily exhibit one of the following problems: 1) they can fail to take the experiment seriously, responding randomly or with little effort, and 2) they can fail to understand the directions with no way of determining this without a pre-test. Given the fact that the study was designed to test perception only, the ability of test subjects to correctly express relative proportions as percentages was required. Unfortunately, this ability was taken for granted. One common error that I found was a reversal of the percentage, such as expressing 10% (one tenth of the value) as 1000% (ten times the value). This problem could have been alleviated by providing subjects with the correct answers for a few examples in preparation for the experimental tasks. An even more common error resulted from the fact that graphs contained three bars and subjects were asked to compare a specific set of two bars in a specific order. Many subjects made the mistake of comparing the wrong bars, which can be easily detected by examining their responses in light of the bars they were shown.
[Note: After posting this blog, I investigated this observation further and discovered that it was flawed. See my comment below, posted on April 5, 2016 at 4:13pm, to find out what I discovered.]
Observation #5: When test subjects cannot be directly observed, greater care must be taken to eliminate extraneous differences in experiments if the results are meant to be compared.
I could have easily skipped to the end of this paper to read its conclusions. Having confirmed that the authors found increases in errors when bars have embellishments, I could have gone on my merry way, content that my assumptions were correct. Had I done this, I would have learned little. Reviewing the work of others, especially in the thorough manner that is needed to publish a critique, is fertile ground for insights and intellectual growth. Everyone in the infovis research community would be enriched by this activity, not to mention how much more useful peer reviews would be if they were done with this level of care.
Take care,
March 31st, 2016
A recent article titled “The Sleeper Future of Data Visualization? Photography” extends the definition of data visualization to a new extreme. Proposing photography as the future of data visualization is an example of the slippery slope down which we descend when we allow the meanings of important terms to morph without constraint. Not long ago I expressed my concern that a necklace made of various ornaments, designed to represent daily weather conditions, was being promoted as an example of data visualization. The term “data visualization” was initially coined to describe something in particular: the visual display of quantitative data. Although one may argue that data of any type (including individual pixels of a digital photograph) and anything that can be seen (including a necklace) qualify as data visualization, by allowing the term to morph in this manner we reduce its usefulness. Photographs can serve as a powerful form of communication, but do they belong in the same category as statistical graphs? A necklace with a string of beads and bangles that represent the last few days of weather might delight, but no one with any sense would argue that it will ever be used for the analysis or communication of data. Yes, this is an issue of semantics. I cringe, however, whenever I hear someone say, “This disagreement is merely semantic.” Merely semantic?! There is nothing mere about differences contained in conflicting meanings.
When I warn against the promiscuous morphing of the terms, I’m often accused of a purist’s rigidness, but that’s a red herring. When I argue for clear definitions, I am fighting to prevent something meaningful and important from degenerating into confusion. Data visualization exists to clarify information. Let’s not allow its definition to contribute to the very murkiness that it emerged to combat. We already have a term for the images that we capture with cameras: they’re called photographs. We have a term for a finely crafted necklace: it’s a piece of art. If that necklace in some manner conveys data, call it data art if you wish, but please don’t create confusion by calling it data visualization.
Aside from the danger of describing photography as data visualization, the article exhibits other sloppy thinking. It promotes a new book titled “Photo Viz” by Nicholas Felton. Here’s a bit of the article, including a few words from Felton himself:
Every data visualization you’ve ever seen is a lie. At least in part. Any graph or chart represents layers and layers of abstraction…Which is why data-viz guru Nicholas Felton…is suddenly so interested in photography. And what started as a collection of seemingly random photos he saved in a desktop folder has become a curated photography book.
“Photo viz for me, in its briefest terms, is visualization done with photography or based on photography,” Felton says. And that means it’s visualization created without layers of abstraction, because every data point in an image is really just a photon hitting your camera sensor.
Abstraction is not a problem that should be eliminated from graphs. Even though millions of photonic data points might be recorded in a digital photograph, they do not represent millions of useful facts. Photos and graphs are apples and oranges. By definition, an individual item of data is a fact. Photos do not contain data in the same sense as graphs do. A fact that appears in a graph, such as a sales value of $382,304, is quite different from an individual pixel in a photo. Graphs are abstractions for a very good reason. We don’t want millions of data points in a graph; we only want the data that’s needed for the task at hand.
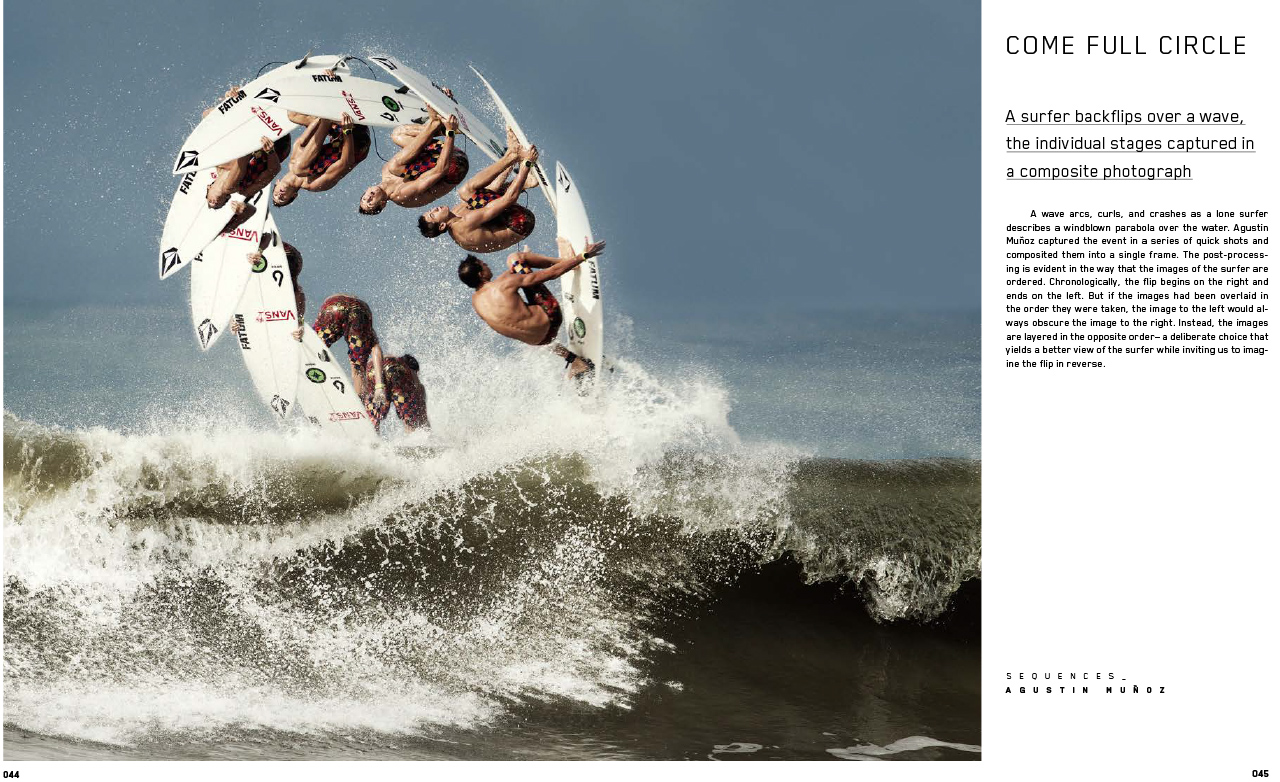
In the following example of photography as data visualization from Felton’s book, the image is wonderfully illustrative and potentially informative.
Although useful, this montage of photographs that illustrates a surfing maneuver is not an example of data visualization. We can applaud such uses of photography without blurring the lines between photographic illustration and data visualization.
A graph is abstract in another sense as well—one that is even more fundamental: a graph is a visual representation of abstract data. Unlike a photo, which represents physical data, graphs give visual form to something that lacks physical form and is in that sense abstract. Financial data is abstract; a flower is physical. I wouldn’t use a photo to represent quantitative data, nor would I use a graph to represent a flower.
How we classify things, each with its kin, matters. Just because a gorilla sometimes stands on two legs, we don’t call him a man.
Take care,
|