Is the Avoidance of 3-D Bar Graphs a Knee-Jerk Reaction?
This is my response to a recent blog article by Robert Kosara of Tableau Software titled “3D Bar Charts Considered Not that Harmful.” Kosara has worked in the field of data visualization as a college professor and a researcher for many years, first at the University of North Carolina and for the last several years at Tableau. He’s not a fly-by-night blogger. But even the advice of genuine experts must be scrutinized, for gaps in their experience and biases, such as loyalties to their employers, can render their advice unreliable.
It has become a favorite tactic of information visualization (infovis) researchers to seek notoriety by discrediting long-held beliefs about data visualization that have been derived from the work of respected pioneers. For example, poking holes in Edward Tufte’s work in particular now qualifies as a competitive sport. Tufte’s claims are certainly not without fault. Many of his principles emerged as expert judgments rather than from empirical evidence. Most of his expert judgments, however, are reliable. While we should not accept anyone’s judgment as gospel without subjecting it to empirical tests, when we test them, we should do so with scientific rigor. Most attempts by researchers to discredit Tufte’s work have been based on sloppy, unreliable pseudo-science.
Back to Kosara’s recent blog article. Here’s the opening paragraph:
We’ve turned the understanding of charts into formulas instead of encouraging people to think and ask questions. That doesn’t produce better charts, it just gives people ways of feeling superior by parroting something about chart junk or 3D being bad. There is little to no research to back these things up.
We should certainly encourage people to use charts in ways that lead them to think and ask questions. Have you ever come across anyone who disagrees with this? Apparently the formulaic understanding of charts that “we” have been promoting produces a sense of superiority, evidenced by the use of terms such as “chart junk,” coined by Tufte. Kosara’s blog entry was written in response to Twitter-based comments about the following 3-D bar graph:

As you can see, this is not an ordinary 3-D bar graph. It starts out as a fairly standard 2-D bar graph on the left and then takes a sudden turn in perspective to reveal an added dimension of depth to the bars that shoot out from the page. Kosara describes the graph as follows:
At first glance, it’s one of those bad charts. It’s 3D, and at a fairly extreme angle. The perspective projection clearly distorts the values, making the red bar look longer in comparison to its real value difference. The bars are also cut off at the base, at least unless you consider the parts with the labels to be the bottoms of the bars (and even then, they’re not the full length to start at 0).
But then, what is this supposed to show? It’s about the fact that a fungicide names [sic] Trivapro produces more yield than the two other products or no treatment. There is no confusion here about which bar is longer. And the values are right there on the chart. You can do some quick math to figure out that a gain of 32 over the base of 146 is an increase of a bit over 20%…
Based on Kosara’s own description, this graph does not communicate clearly and certainly isn’t easy or efficient to read. He goes on to admit this fact more directly.
Is this a great chart? No. It’s not even a good chart. Is this an accurate chart? No. Though it has the numbers on it, so it’s less bad than without.
Lest we rashly render the judgment that this graph deserves, Kosara cautions, “It is much less bad than the usual knee-jerk reaction would have you think, though.” Damn, it’s too late. My knee already jerked with abandon.
The gist of Kosara’s article is two-fold: 1) 3-D graphs are not all that bad, and 2) we should only be concerned with problems that researchers have confirmed as real. It would be great if we could rely on infovis researchers to serve as high priests of graphical Truth, but relatively few of them have been doing their jobs. His own recent studies and the others that he cites in the article are fundamentally flawed. This includes the respected study on which Kosara bases his claim that 3-D effects in graphs are “not that harmful,” titled “Reading Bar Graphs: Effects of Extraneous Depth Cues and Graphical Context” by Jeff Zacks, Ellen Levy, Barbara Tversky, and Diane Shiano This paper, published in the Journal of Experimental Psychology: Applied in 1998, missed the mark.
The 1998 study consisted of five experiments. The first two experiments contain the findings on which Kosara bases his defense of 3-D bar graphs. In the first experiment, test subjects were shown a test bar in a rectangular frame, which was rendered in either 2D or 3D. My reproductions of both versions are illustrated below.
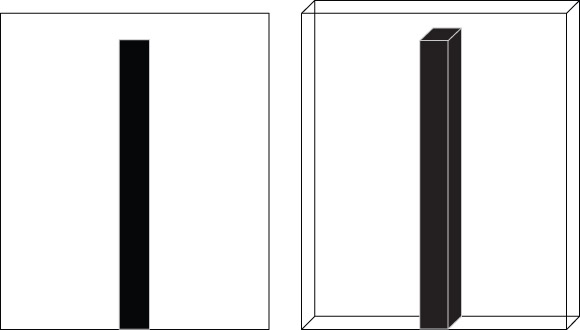
By only slightly manipulating the perspective of the 3-D bar, it was kept as simple as possible, giving it the best possible chance of causing no harm. Subjects were then asked to match the test bar to one of the bars in a separate five-bar array. The bars in the array ranged in height from 20 millimeters to 100 millimeters in 20-millimeter increments. Two versions of the five-bar array were provided—one with 2-D bars and one with 3-D bars—one on each side of a separate sheet of paper. Half of the time the test bar was shown alone, as illustrated above, and the other half a second context bar appeared next to the test bar, but the test bar was always marked as being the one that should be matched to a bar in the five-bar array. The purpose of the context bar was to determine if the presence of another bar of a different height from the test bar had an effect on height judgments. This experiment found that subjects made greater errors in matching the heights of 3-D vs. 2-D bars, as expected. It also found that the presence of context bars had no effect on height judgments.
It was the second experiment that led Kosara to claim that 3-D effects in bars ought not to concern us. The second experiment was exactly like the first, except for one difference that Kosara described as the addition of a “delay after showing people the bars.” He went on to explain that this delay eliminated differences in height judgments when viewing 2-D vs. 3-D bars, and further remarked, “That is pretty interesting, because we don’t typically have to make snap judgments based on charts.” Even on the surface this comment is wrong. When we view bar graphs, the perceptual activity of reading and comparing the heights of the bars is in fact a snap judgment. It is handled rapidly and pre-attentively by the visual cortex of the brain, involving no conscious effort. The bigger error in Kosara’s comment, however, is his description of the second experiment as the same as the first except for a “delay” after showing people the bars. The significant difference was not the delay, however, but the cause for the delay. After viewing the test bar, subjects were asked to remove it from view by turning the sheet of paper over, placing it on the desk, and then retrieving a second sheet on which the test bar no longer appeared before looking at the five-bar matrix to select the matching bar. In other words, when they made their selection the test bar was no longer visible, which meant that they were forced to rely on working memory as their only means of matching the test bar to the bar of corresponding height in the five-bar matrix.
When subjects were forced to rely on working memory rather than using their eyes to match the bars, errors in judgment increased significantly overall. In fact, errors increased so significantly that the difference seen in the first experiment related to 2-D vs. 3-D bars disappeared. Put differently, the increase in judgment errors increased so much when relying on working memory that the lesser differences based on 2D vs. 3D became negligible in comparison.
Another difference surfaced in the second experiment, which Kosara interpreted as further evidence that 3-D effects shouldn’t concern us when compared to greater problems.
The other effect is much more troubling, though: neighboring bars had a significant effect on people’s perception. This makes sense, as we’re quite susceptible to relative size illusions like the Ebinghaus [sic] Effect (in case you haven’t seen it, the orange circles below are the same size).
What this means is that the data itself causes us to misjudge the sizes of the bars!
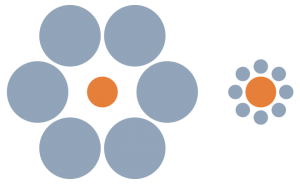
Where to begin? The Ebbinghaus Illusion pertains specifically to the areas of circles, not the lengths of bars. Something similar, called the Parallel Lines Illusion, was what concerned the authors of the 1998 study (see below).
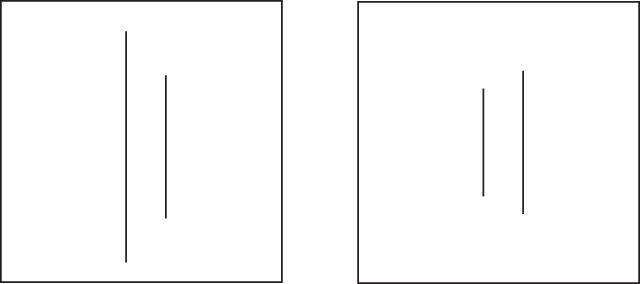
Most people perceive the right-hand line in the frame on the left as longer than the right-hand line in the frame on the right, even though they are the same length. As you can see in my illustration below, however, this illusion does not apply to lines that share a common baseline and a common frame, as bars do. The second and fourth lines appear equal in height.

Also, if the presence of context bars caused subjects to make errors in height judgments, why wasn’t this effect found in the first experiment? Let’s think about this. Could the fact that subjects had to rely on working memory explain the increase in errors when context bars were present? You bet it could. The presence of two visual chunks of information (the test bar and the context bar) in working memory rather than one (the test bar only) increased the cognitive load, making the task more difficult. The second experiment revealed absolutely nothing about 2-D vs. 3-D bars. Instead, it confirmed what was already known: working memory is limited and reliance on it can have an effect on performance.
In the last paragraph of his article, Kosara reiterates his basic argument:
It’s also important to realize just how little of what is often taken as data visualization gospel is based on hearsay and opinion rather than research. There are huge gaps in our knowledge, even when it comes to seemingly obvious things. We need to acknowledge those and strive to close them.
Let me make an observation of my own. It is important to realize that what is often claimed by infovis researchers is just plain wrong, due to bad science. I wholeheartedly agree with Kosara that we should not accept any data visualization principles or practices as gospel without confirming them empirically. However, we should not throw them out in the meantime if they make sense and work, and we certainly shouldn’t reject them based on flawed research. The only reliable finding in the 1998 study regarding 2-D vs. 3-D bars was that people make more errors when reading 3-D bars. Until and unless credible research tells us differently, I’ll continue to avoid 3-D bar graphs.
(P.S. I hope that Kosara’s defense of 3-D effects is not a harbinger of things to come in Tableau. That would bring even more pain than those silly packed bubbles and word clouds that were introduced in version 8.)
Take care,

8 Comments on “Is the Avoidance of 3-D Bar Graphs a Knee-Jerk Reaction?”
It has become extremely tiresome to
1) have every critique of a bad practice, or advocacy of a good practice, be met with a wave of anti-Tufte hysteria, and
2) see reputable people in the Data Vis community write piece after piece claiming that terrible charts are actually ok (I can’t find the link right now to a recent piece “busting” the “myth” that pie charts are bad, for example).
We have truly turned a ridiculous corner in data visualization critique and practice that leaves me bewildered almost daily.
When we have major players defending pie charts and 3D, all hope is lost. Every person looking for a reason not to pursue better data visualization techniques who comes across such posts, will from then on dismiss any critiques of their bad practice they encounter – no matter how much evidence exists.
jlbriggs,
One step forward, three steps backward seems to be the norm in data visualization these days. It’s more frustrating than I can possibly express when one of the communities that is supposedly dedicated to progress in data visualization–the infovis research community–is doing so much to set us back. It is likely that some data visualization principles and practices that we have held dear for years should be revised through good empirical research, but that research must be done well and without bias. Few studies that focus on graph design best practices, however, have exhibited scientific integrity. Unfortunately, some of the worst papers have received the most attention in the media and are most often cited in other research papers. Until people in the infovis research community who know better rasie their voices in protest, we’re in for more of the same in the foreseeable future. If a single infovis researcher of prominence spoke out, others would find courage to speak out as well. I continue to hope that this will happen, which is why I continue to raise my own voice so often and so clearly.
jlbriggs, you may be referring to this post that proclaims Tufte, Few, and Nussbaumer all being wrong about pie charts … http://speakingppt.com/2013/03/18/why-tufte-is-flat-out-wrong-about-pie-charts/
I prefer this article for repurposing 3D pie charts with something more useful … http://www.darkhorseanalytics.com/blog/salvaging-the-pie
I noticed this article a couple of days ago and was pretty disappointed to say the least. It felt almost as if the argument was “the graph itself isn’t that important as long as you add labels”.
If Tableau adds 3D graphs, I believe it will only be due to “market pressure” and certainly not out of any desire to further the cause of effective data visualization.
Jonathon – that’s not the one I had in mind, though I have seen that one also, and it is very similar in content and tone.
The one I was trying to find (and still can’t) mimicked the Myth Busters idea, and declared the myth of pie charts being bad “Busted!” at the end, with a big stamp graphic and all.
Eye-roll worthy, if not for the reach and impact such articles will have.
Wow, look what I dug up in the comments from one of Jonathan’s links:
http://www.envisionfinancials.com/live-demo/
Steve, I couldn’t resist a reaction to the referred article at the time on twitter. My thought on the referred article was, without the ~110 letter limit: from a readability viewpoint, it’s not even a 3D (or any) bar chart as much as a simple table of numbers, with weird ‘art’ added as some distracting background. This background illustration, called a 3D bar chart by the article, does a lot to confuse and disorient (for the reasons you enlist), however as it’s basically just a very small table of numbers in a weird arrangement, some readability remains. It does not make it a good chart of course, but works as an explanation different from that of Robert Kosara’s on why it’s not 100% unreadable. I’d be surprised though if this chart weren’t making the circles as a WTFviz for to the broken, elbowed bar, the abrupt switch from 2D to 3D at the elbow, the puzzling gradient shading on the very left and the ‘trains zooming past the reader’ effect on the very right.
Hi Robert, completely agree with your take on the chart/table. But even as a table it fails. To better understand the analysis we would need more contextual information such as the number of data points (acres), the variation of the estimates, if comparable amounts (of pesticide) were used, etc. What we have here is useless irrespective of if its in 2D or 3D.
Mark, yes, indeed; the points you raise are above and beyond the narrower context of why a 4×2 number table remains somewhat readable, in the literal sense. Since the numbers are quite big, the stylized high-rise aerial view backdrop might as well be replaced with dinosaurs for enhanced memorability of something that lacks the broader context anyway.